🔍 Jamaica Plain Single-Family Sales Snapshot: A Tale of Two Quarters in 2025
If you’ve been keeping an eye on the Jamaica Plain real estate market—or if you’re wondering whether now’s the time to buy or sell—a closer look at the 2025 single-family home sales data reveals a fascinating story of shifting momentum, pricing volatility, and changing buyer behavior.
After working in Boston real estate for 20+ years, I can tell you: this year is anything but typical.
📈 First Quarter vs. Second Quarter 2025: The Numbers Tell the Story
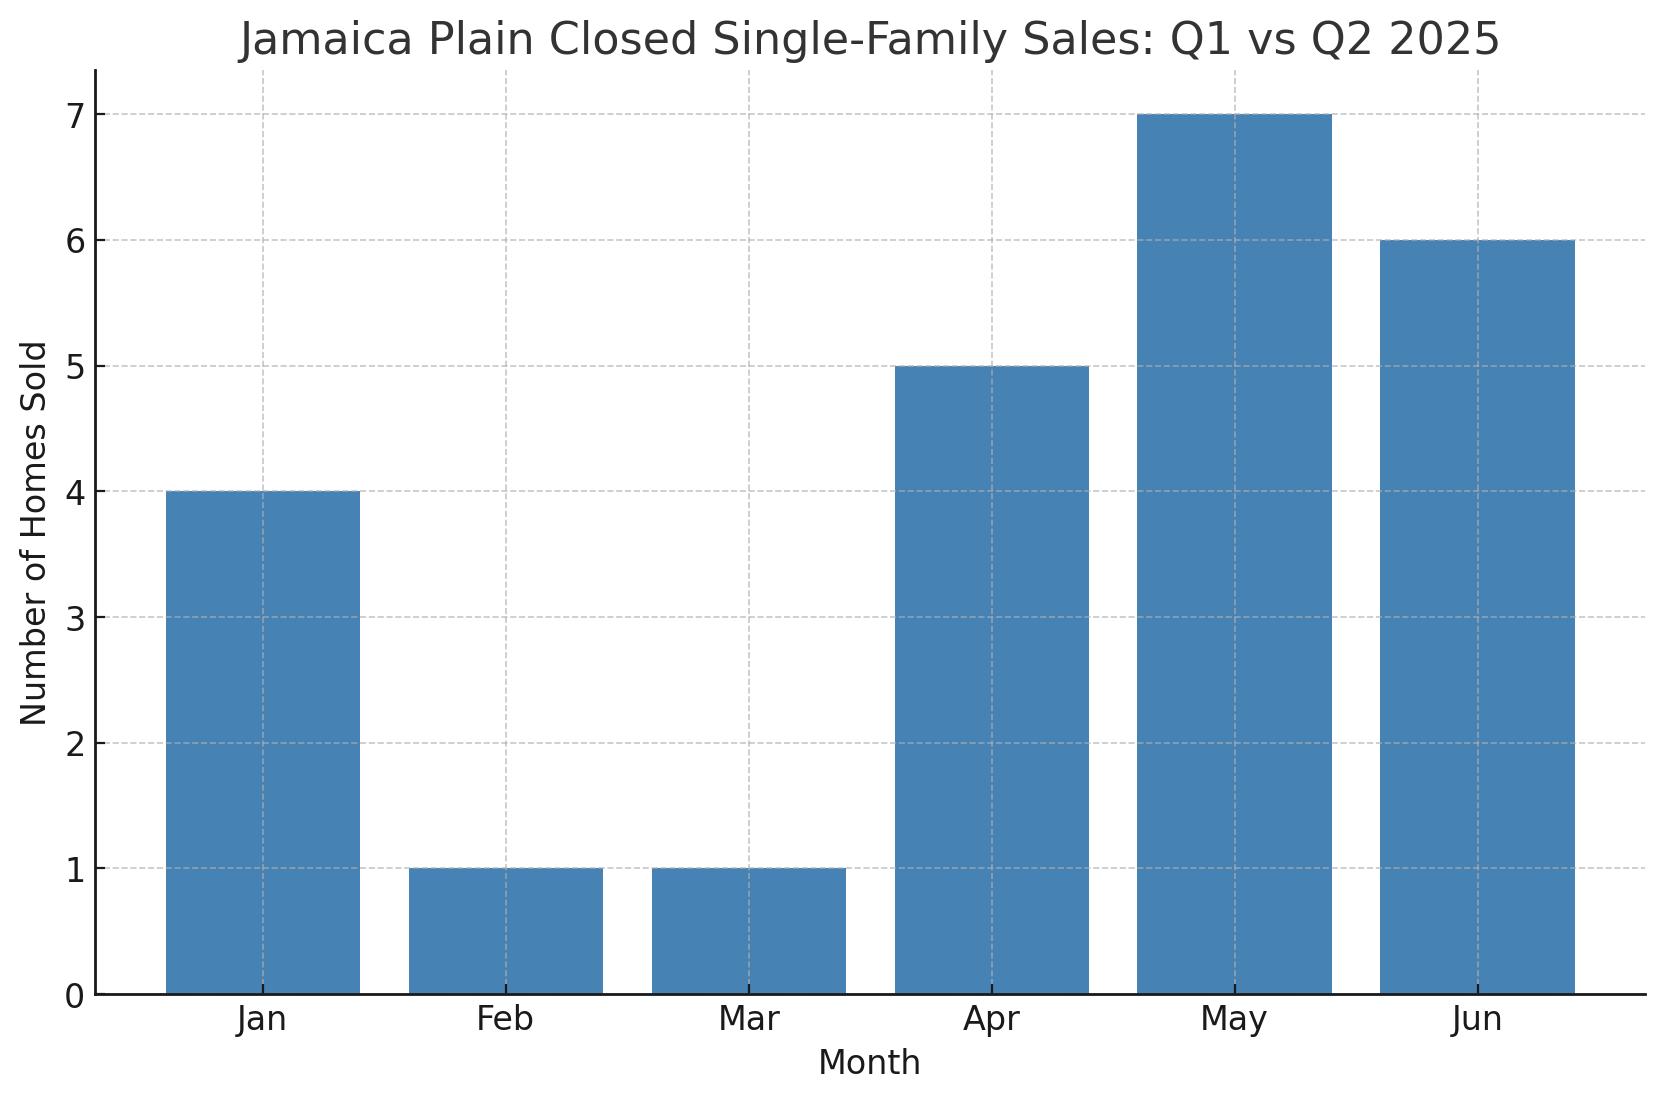
✅ Homes Closed
Q1 Total (Jan–Mar): 6 homes
Q2 Total (Apr–Jun): 18 homes
➡️ The number of homes sold tripled in Q2, indicating a massive surge in market activity.
⏱️ Days on Market (DOM)
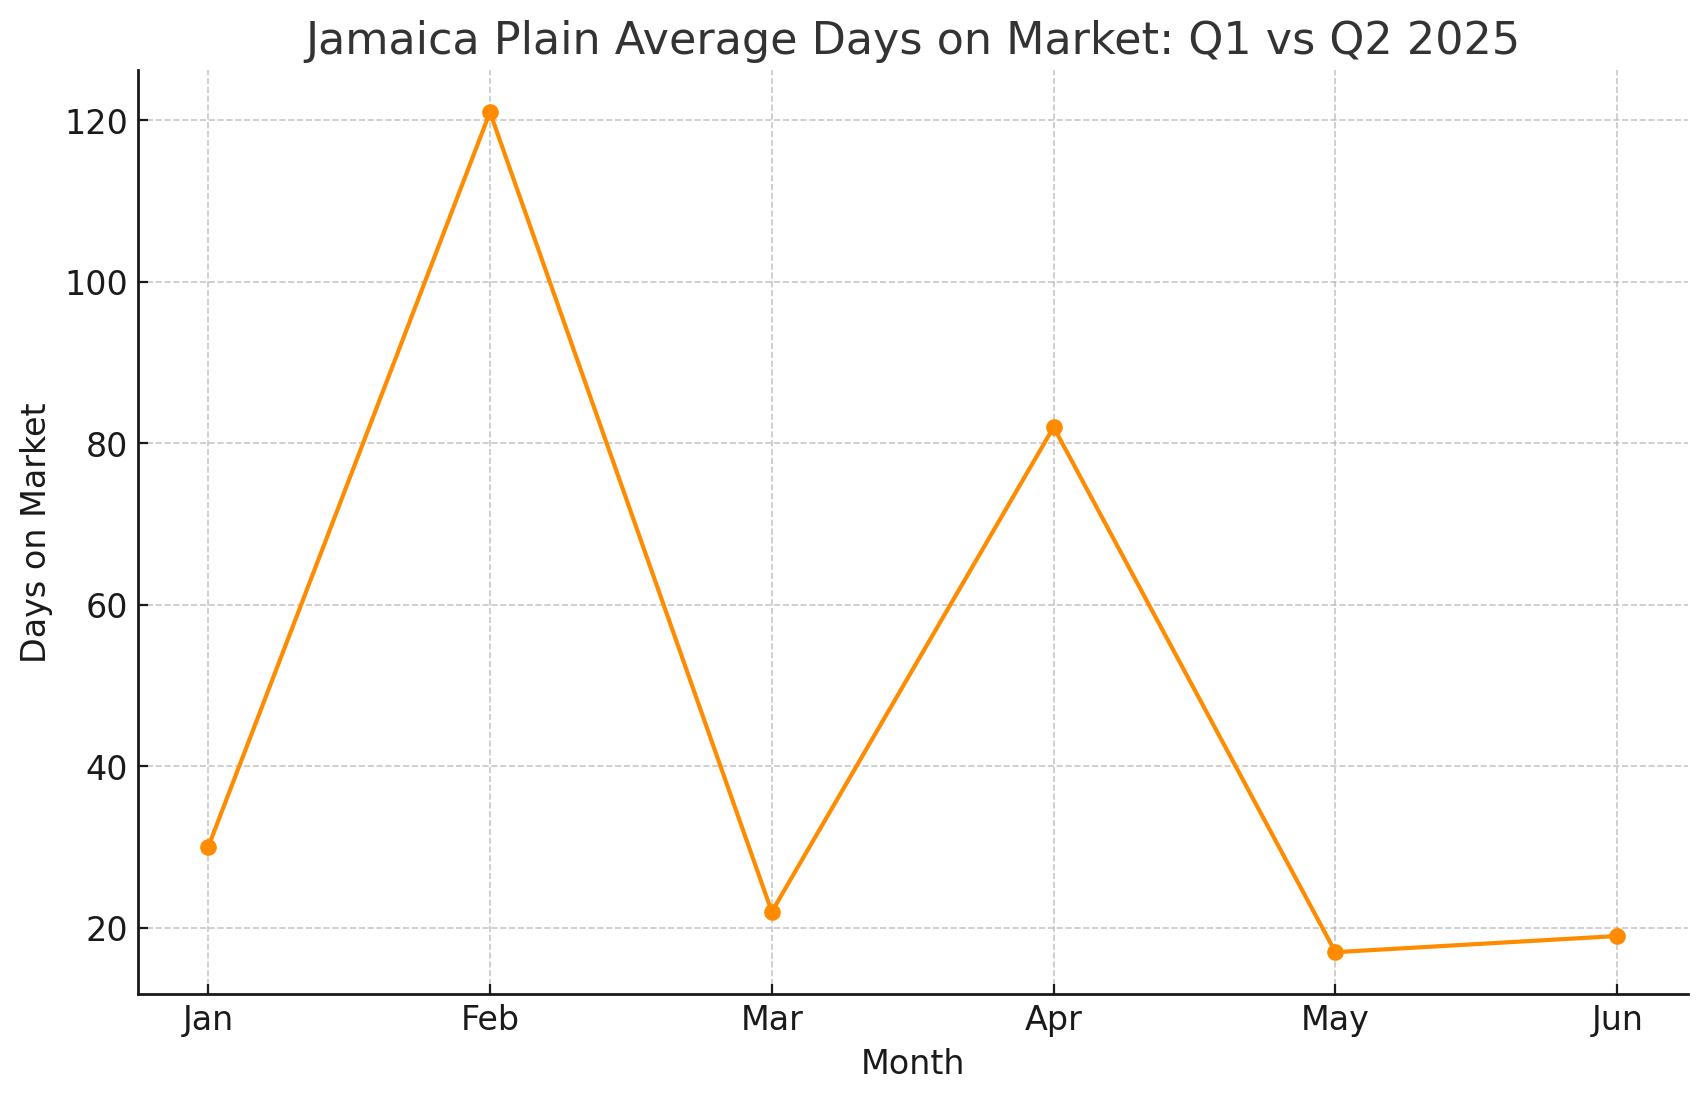
Q1 Trend: 30 (Jan) → 121 (Feb) → 22 (Mar)
Q2 Trend: 82 (Apr) → 17 (May) → 19 (Jun)
➡️ The huge spike in February and April was an outlier. From March through June, homes sold fast, often within two to three weeks.
💸 Over Asking Sales
Q1: Only two homes sold above asking
Q2: 13 homes sold above asking
➡️ That’s a profound shift in negotiating power. Buyers are bidding aggressively again.
🏷️ Median Sales Price 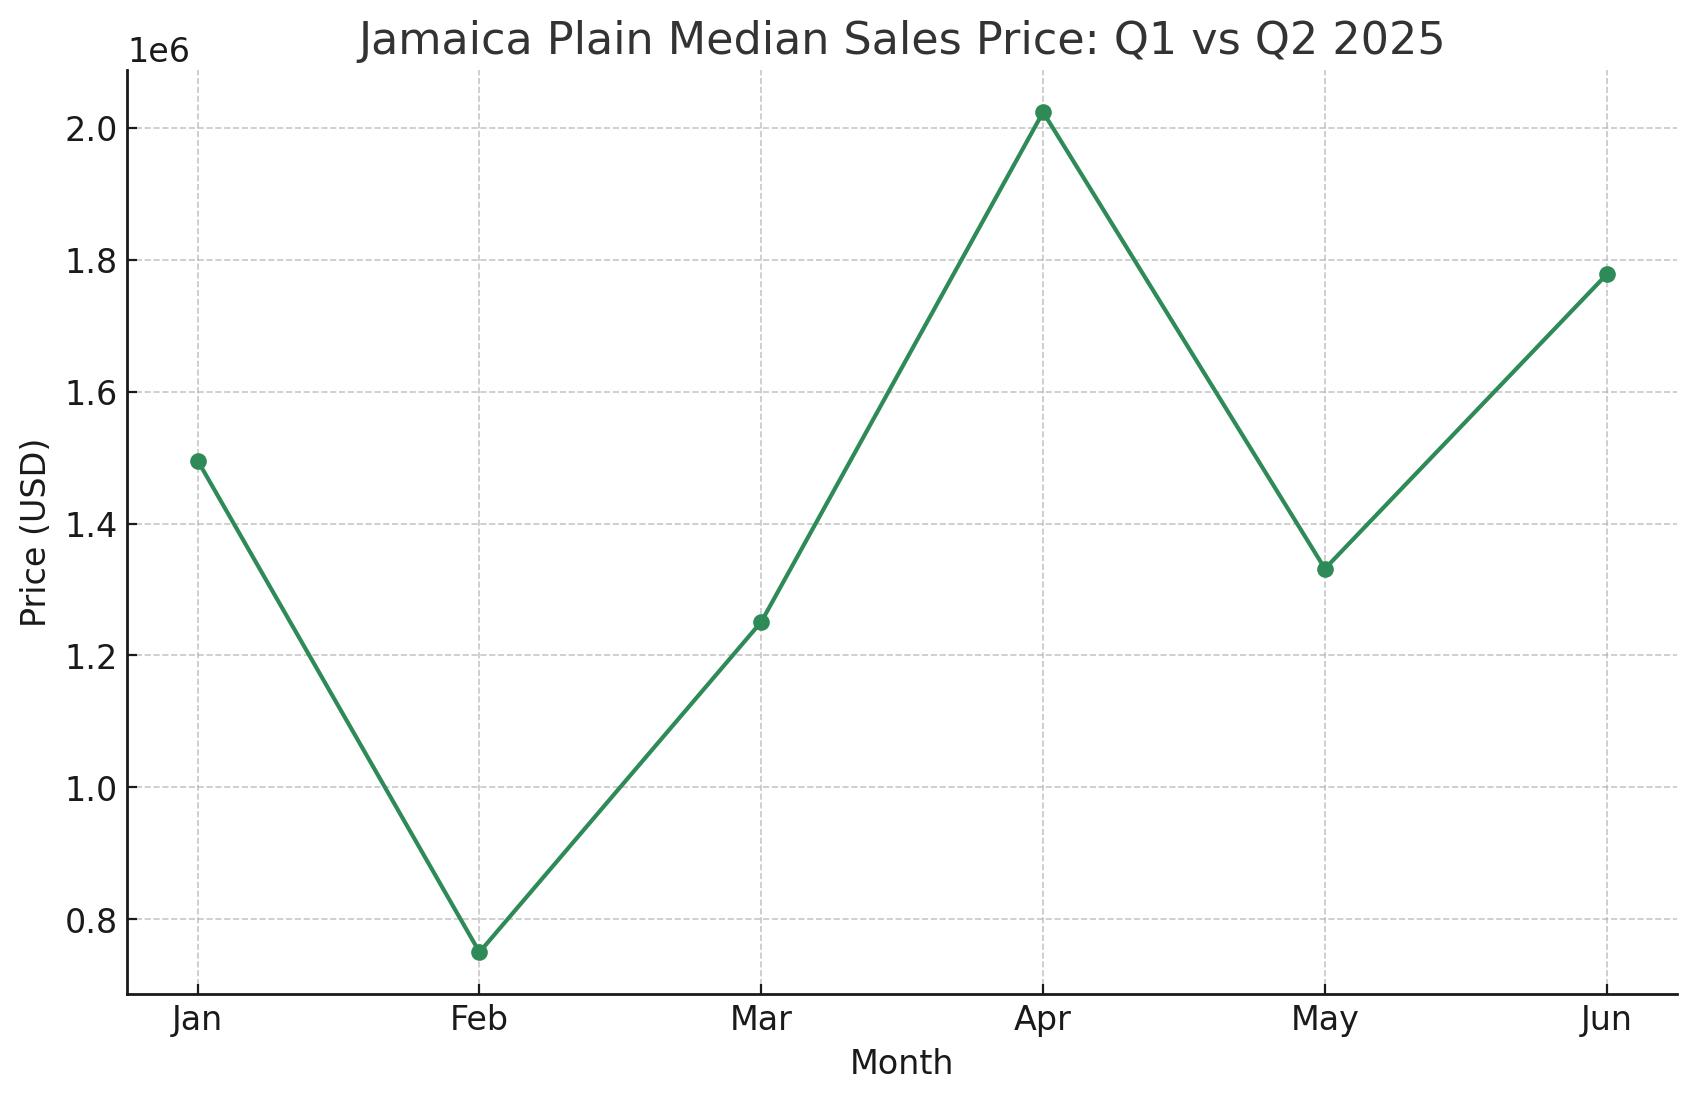
Q1 Trend: $1,495,550 → $750,000 → $1,251,000
Q2 Trend: $2,024,000 → $1,331,571 → $1,778,017
➡️ Median prices were all over the place. April’s $2M+ median is a significant outlier, likely driven by a luxury sale.
🔎 Less Obvious—but Crucial—Insights
1. Don’t Trust Just the Median Price
With only six homes sold in Q1 and 18 in Q2, one or two high-end sales can skew the data. That $2M sale in April? Likely an exceptional home—not the norm.
2. Sellers Are Regaining Leverage
In Q1, nearly all homes sold below asking. In Q2, 13 homes sold above asking. That’s a big deal. It indicates that buyers are returning and competition is intensifying.
3. Seasonal Timing Matters—A Lot
Q2 was not just more active—it was fiercely competitive. But Q1 offered better deals and less competition. If you’re planning to buy or sell, timing your move can mean the difference between a bidding war and a bargain.
📊 2024 vs. 2025: Year-over-Year Breakdown
🧮 First Quarter Comparison
List Price: $1,252,614 (2025) vs. $1,268,250 (2024) ↓ 1.2%
Sale Price: $1,256,743 (2025) vs. $1,256,050 (2024) ↑ 2.4%
DOM: 43 (2025) vs. 87 (2024)
✅ More efficient, slightly higher prices in 2025 Q1.
💰 Second Quarter Comparison
List Price: $2,137,532 (2025) vs. $1,667,889 (2024) ↑ 22.4%
Sale Price: $1,686,552 (2025) vs. $1,348,008 (2024) ↑ 25%
DOM: 54 (2025) vs. 15 (2024)
⚠️ Homes are selling for more, but taking longer to move, which indicates buyers are pushing back on pricing.
💡 Key Takeaways
For Buyers:
If you’re house-hunting in Q2, expect competition. Act fast and come prepared.
Q1 gives you more negotiating room—less competition, lower prices.
For Sellers:
The market is leaning in your favor, especially in Q2. But don’t chase unicorn pricing.
Price is right to attract multiple offers. Overpricing will slow you down—even in a hot market.
💬 Let’s Talk Strategy
Whether you’re buying your first home or selling a long-time investment, navigating today’s market requires more than luck—it takes a data-driven plan, local expertise, and strategic timing.
📲 Follow me on Instagram @PageInnisRE for neighborhood tours and insights
📘 Like my Facebook Page, Page Innis Real Estate, for market updates
▶️ Watch on YouTube Page Innis Boston RE for property walk-throughs & trend breakdowns
🌐 Explore listings and book a consult at www.pageinnisrealestate.com
Let’s make your next move a smart one.



Leave a Reply