North End Rental Market Update: Q1 vs Q2 2025 — What Renters, Landlords, and Investors Need to Know
 If you’re renting or investing in the North End, you’re likely already aware that the market can shift quickly—and 2025 is no exception. With over 18 years of experience in real estate across Boston and the Lakes Region of New Hampshire, I’ve seen my fair share of market swings. Still, this year’s rental data tells a particularly fascinating story. Let’s dive into what’s happening, why it matters, and how you can make smarter decisions—whether you’re looking to rent, invest, or adjust your rental strategy as a landlord.
🔍 Quarterly Activity and Market Trends
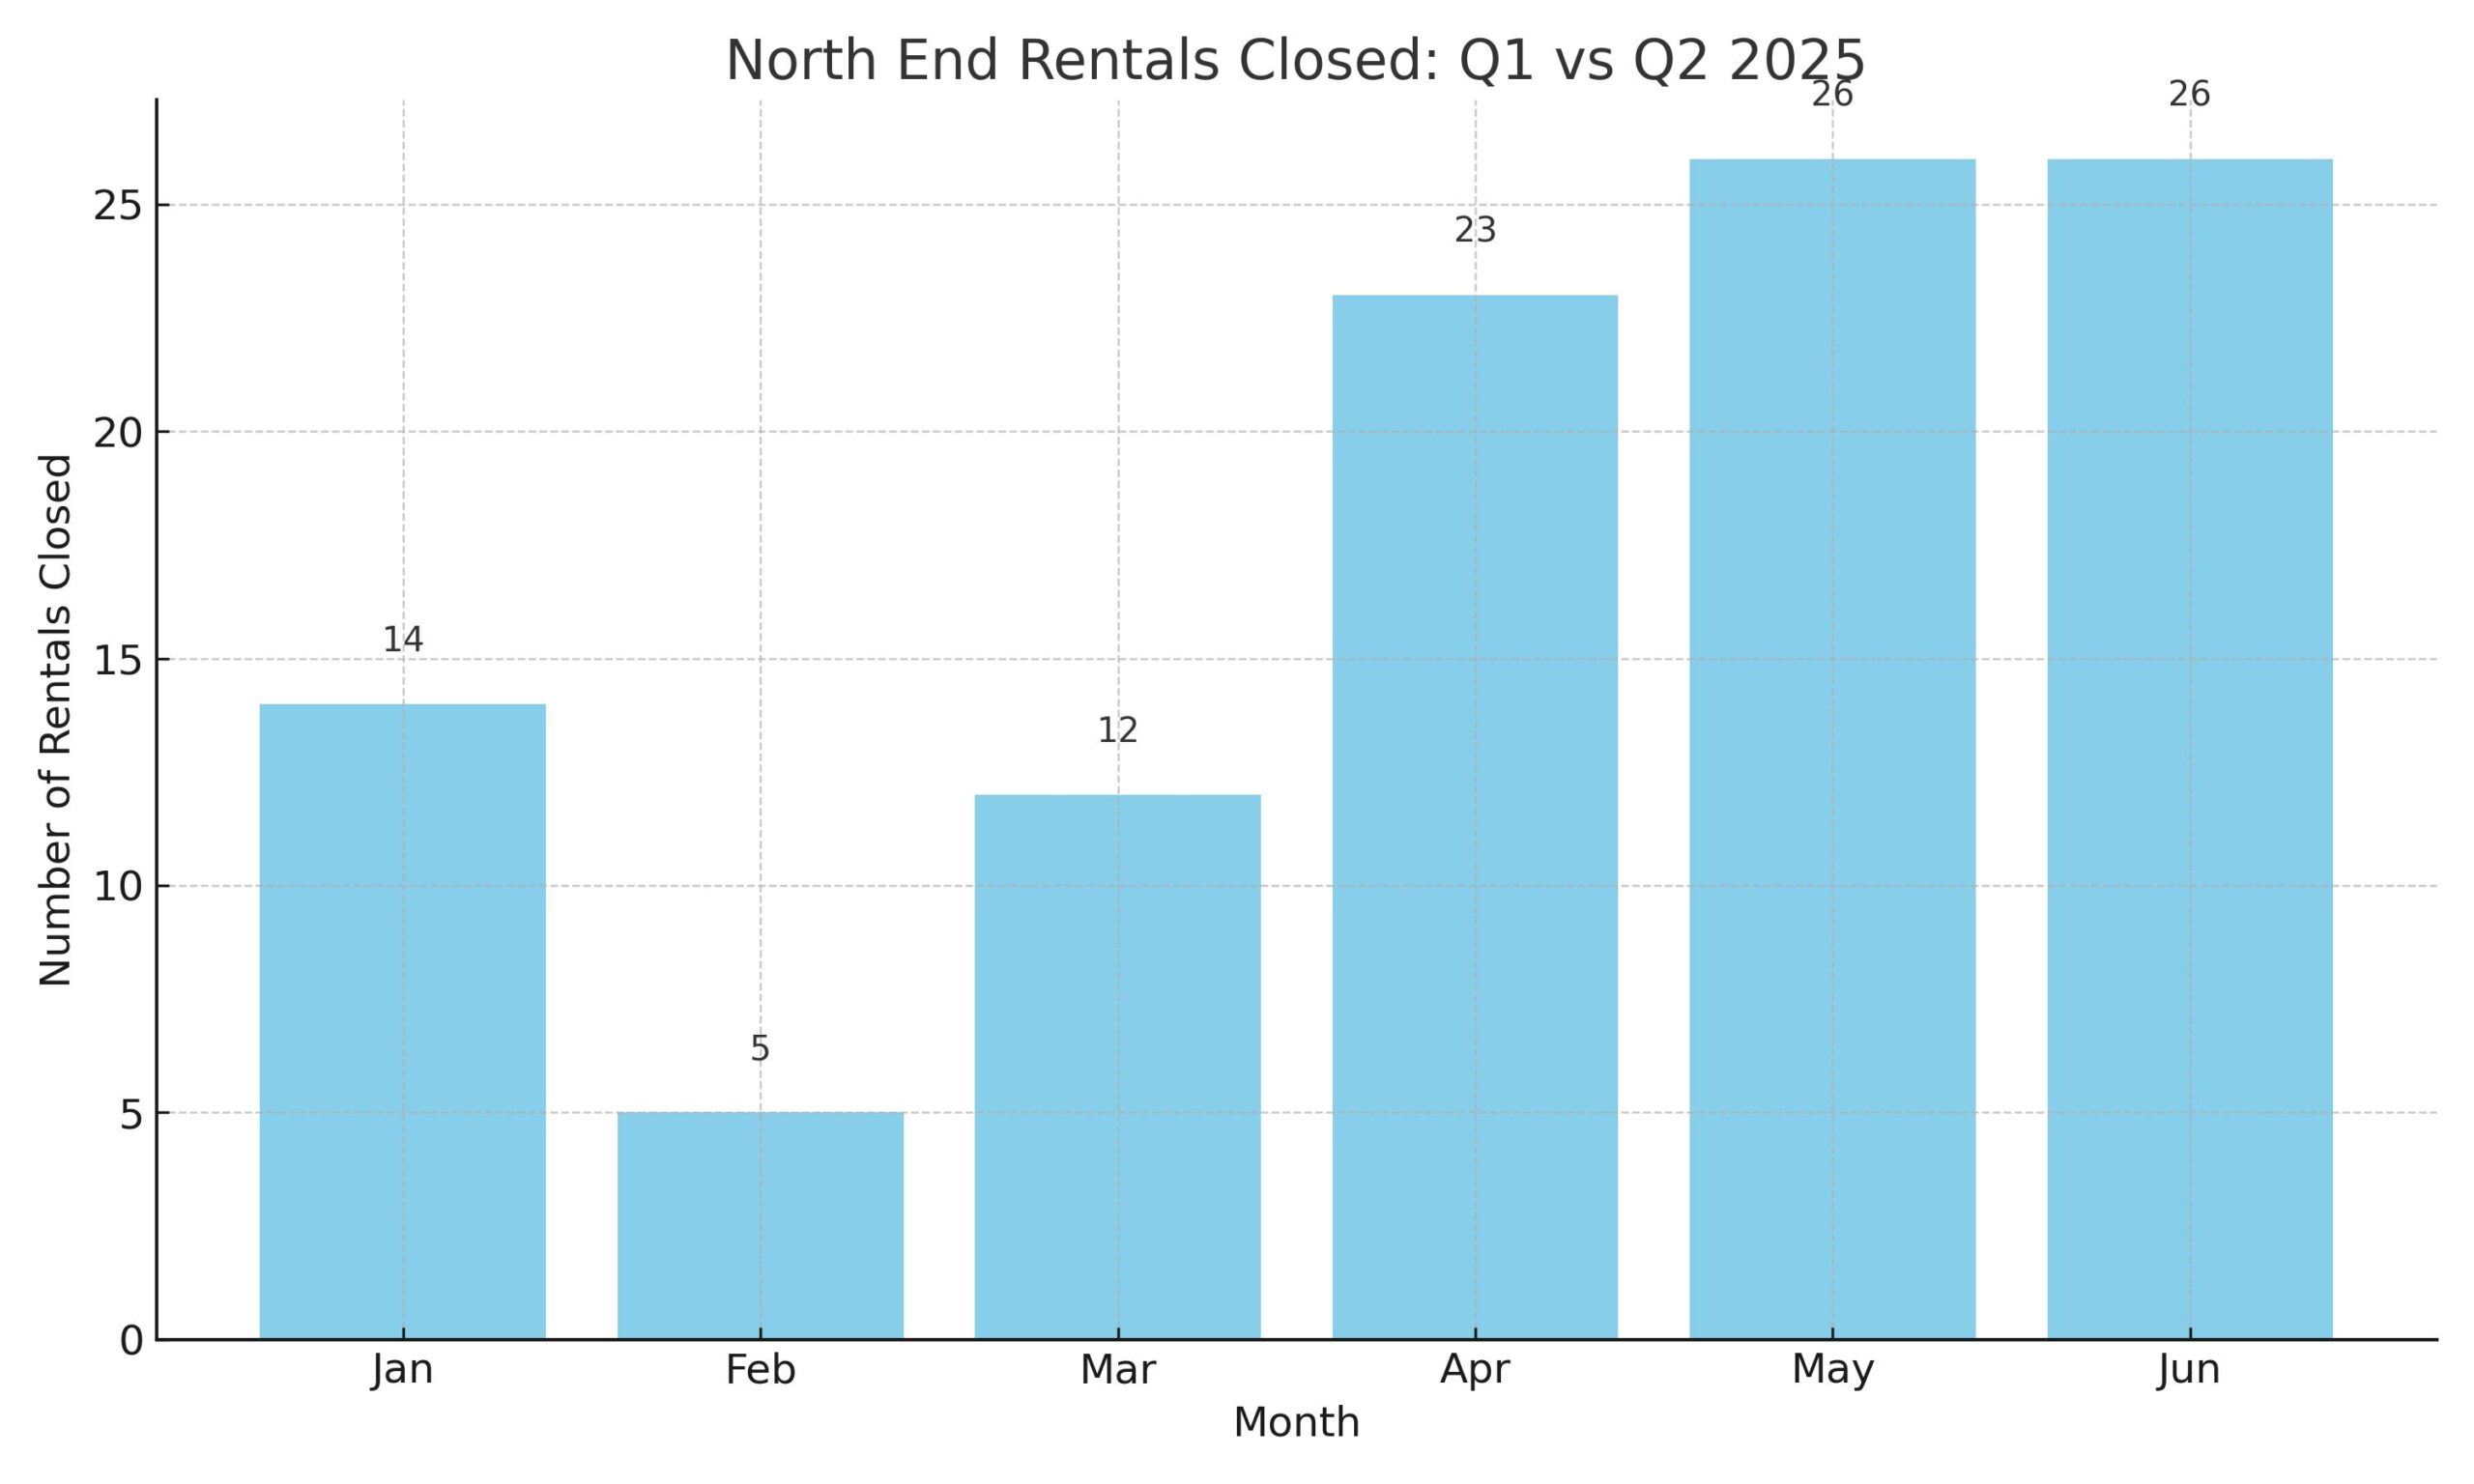 📈 Closed Rentals More Than Doubled in Q2
Q1 2025: 31 rentals closed
Q2 2025: 75 rentals closed
➡️ +142% increase — driven by the traditional September 1st rental surge in Boston
⏳ Days on Market Plummeted
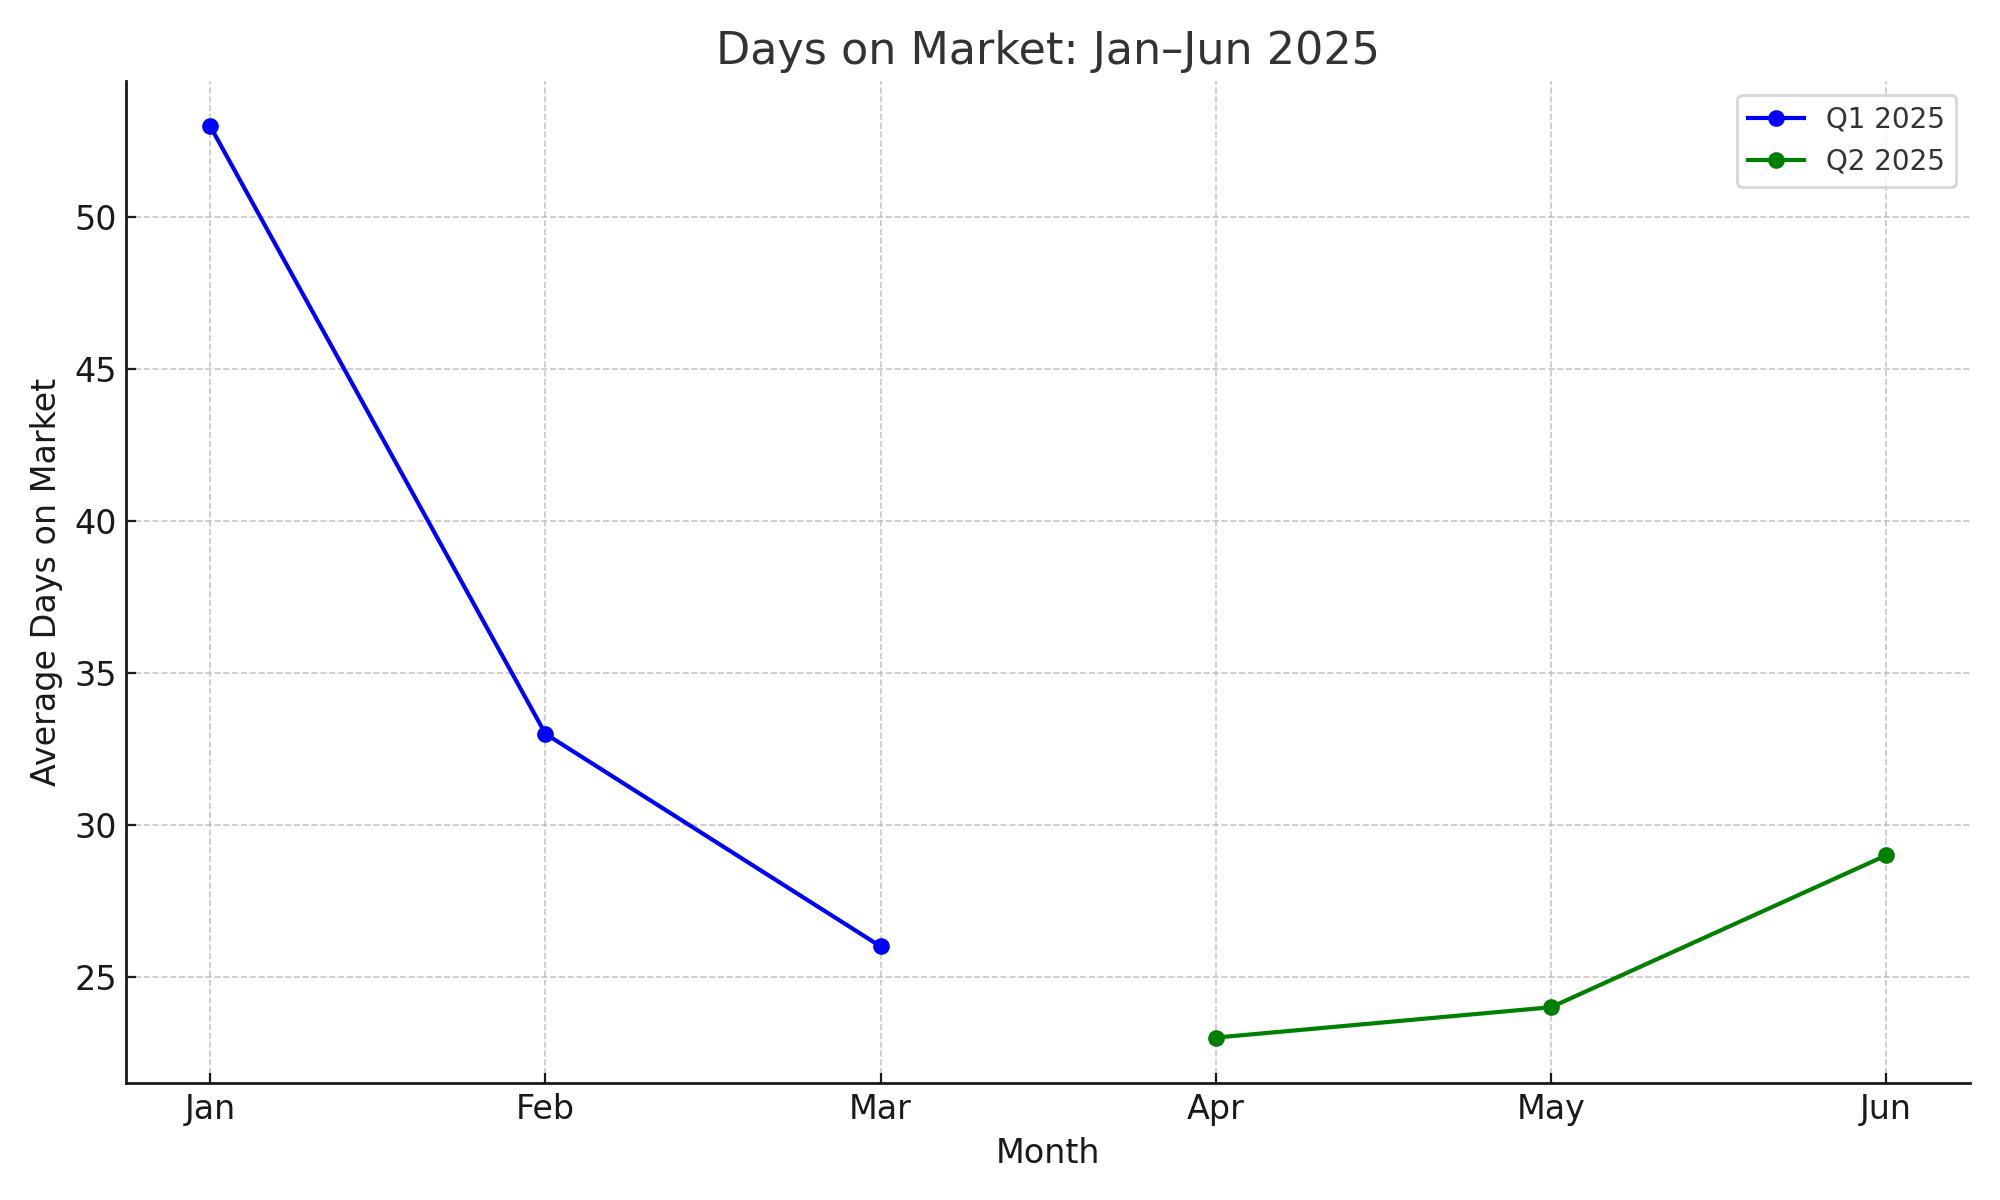
Blue line = Q1 (Jan–Mar)
Green line = Q2 (Apr–Jun)
This chart clearly illustrates the market’s acceleration in Q2.
Q1 DOM dropped from 53 to 26 days by March.
Q2 DOM averaged just 25 days.
➡️ Homes are renting faster—tenants are acting quickly, and landlords are pricing sharply.
💰 Over Asking Bids Surged
Q1: Only two rentals closed above the asking price.
Q2: 9 units closed above the asking price.
➡️ We’re seeing more competition—but not necessarily across the board.
💸 Rental Prices by Apartment Size
Unit Type Q1 2025 Avg Q2 2025 Avg % Change
Studios $1,750 $2,262 +29% (but still down YoY)
1-Bedrooms $3,021 $2,988 -1.1%
2-Bedrooms $3,700 $4,550 +23%
3-Bedrooms $4,950 $5,560 +12%
🧠 Takeaway: Studio prices are still significantly down compared to last year, while 2- and 3-bedroom rentals are appreciating steadily. The one-bedroom market is soft—great for renters, but a flag for landlords.
📊 Year-Over-Year Rental Trends
Unit Type Q1 2024 vs 2025 Q2 2024 vs 2025</p>
Studios -20% -26%
1-Bedrooms -11% -3.8%
2-Bedrooms -7% +3.8%
3-Bedrooms +2% +7%
Overall Median Rent $3,651 ➝ $3,425 (-6.2%) $3,716 ➝ $3,722 (+0.14%)
👀 Important Insight: The average rent doesn’t tell the whole story—specific segments like studios are correcting sharply, while others like 3-bedrooms are holding strong and r
ising.
💡 Hidden Market Signals
One-Bedroom Oversupply? Prices dropped in both the first and second quarters. If you’re an investor, be cautious here.
Studio Market Correction: The sharp drop indicates last year’s highs weren’t sustainable. This segment is adjusting fast.
Q2 Still Dominates: Even in a correcting market, Q2 remains the peak season for speed and competition.
📌 What This Means for You
🔑 Landlords
Price competitively and time your listings for Q2. If you’re holding studio or 1-bedroom inventory, be realistic—it’s not 2024 anymore.
🔑 Investors
Two- and three-bedroom units are your safest bets right now. Expect solid appreciation and demand—primarily in Q2.
🔑 Renters
If you’re searching in Q2, be prepared to act quickly. But if you can rent in Q1, you’ll likely find better deals and less competition.
🎯 Final Thoughts
As a longtime real estate agent in Boston, I’m seeing a clear pattern: we’re entering a more segmented, data-driven rental market. Pricing, timing, and unit size all matter more than ever.
If you’re thinking about renting, investing, or adjusting your current strategy—don’t go it alone. Let’s talk about how to position yourself in this changing market.
📱 Connect with me on Instagram, Facebook, or YouTube, or visit pageinnisrealestate.com to stay on top of what’s happening in Boston and the Lakes Region.
📆 Weekly Updates to Watch For:
Every Monday: Sales Market Report (Metro Boston + Surrounding Areas)
Every Tuesday: Rental Market Report (Metro Boston + Surrounding Areas)
Once a Month: Lakes Region Spotlight



Leave a Reply