Midtown Boston Rental Market: What Q1 vs Q2 2025 Is Telling Us
If you’ve ever looked for a rental in Boston, you know the Midtown market has its own pulse—and 2025 is no exception. With over 20 years in Boston real estate, I’ve seen my fair share of wild swings, but this year’s Q1 and Q2 data have some real stories to tell. So let’s dive in.
📈 The Surge in Rental Activity
In the first quarter of 2025 (January through March), only 22 Midtown rentals closed. But by the second quarter (April through June)? That number exploded to 60 closed rentals. That’s a 173% increase.
Why the jump? Boston’s classic September 1st rental cycle is likely the driver. Renters start shopping months in advance, which means Q2 is a high-competition season. If you’re listing, this is when the sharks begin circling.
🏃♂️ The Market Is Moving Fast
In Q1, rentals sat on the market for an average of 71 days. By Q2? That number dropped to just 36 days. That’s half the time—and if you’re a landlord, that’s music to your ears. If you’re a renter, it’s your sign to act fast if you see something you like.
💸 Over-Asking Rentals Are on the Rise
It’s no secret: bidding wars are becoming more common—yes, even in the rental market.
Q1 2025: 3 units rented over asking
Q2 2025: 6 units rented over asking
More competition, tighter inventory, and stronger demand mean more people are willing to pay a premium for well-priced, well-marketed apartments.
🔎 Let’s Talk Rent Prices: Q1 vs. Q2, 2024 vs. 2025
Across the board, rental prices in Midtown are increasing. But the nuance lies in the unit size and season. Let’s break it down:
💼 Studios
Q1 2024: $2,800 → Q1 2025: $2,900 (⬆ 3.6%)
Q2 2024: $2,812 → Q2 2025: $3,000 (⬆ 6.7%)
Steady, predictable growth. Ideal for conservative investors.
Q1 2024: $4,612 → Q1 2025: $3,642 (⬇ 21%)
Q2 2024: $4,230 → Q2 2025: $4,312 (⬆ 1.9%)
Volatile—but rebounds quickly. Be cautious with Q1 listings.
🛏🛏 Two Bedrooms
Q1 2024: $6,536 → Q1 2025: $6,125 (⬇ 6.3%)
Q2 2024: $6,844 → Q2 2025: $7,683 (⬆ 12%)
Landlord’s dream in Q2, but risky in Q1.
🛏🛏🛏 Three Bedrooms
 Q1 2024: $13,000 → Q1 2025: $11,960 (⬇ 8%)
Q2 2024: $8,400 → Q2 2025: $9,431 (⬆ 12%)
Huge swings. High reward, high risk. Not for the faint of heart.
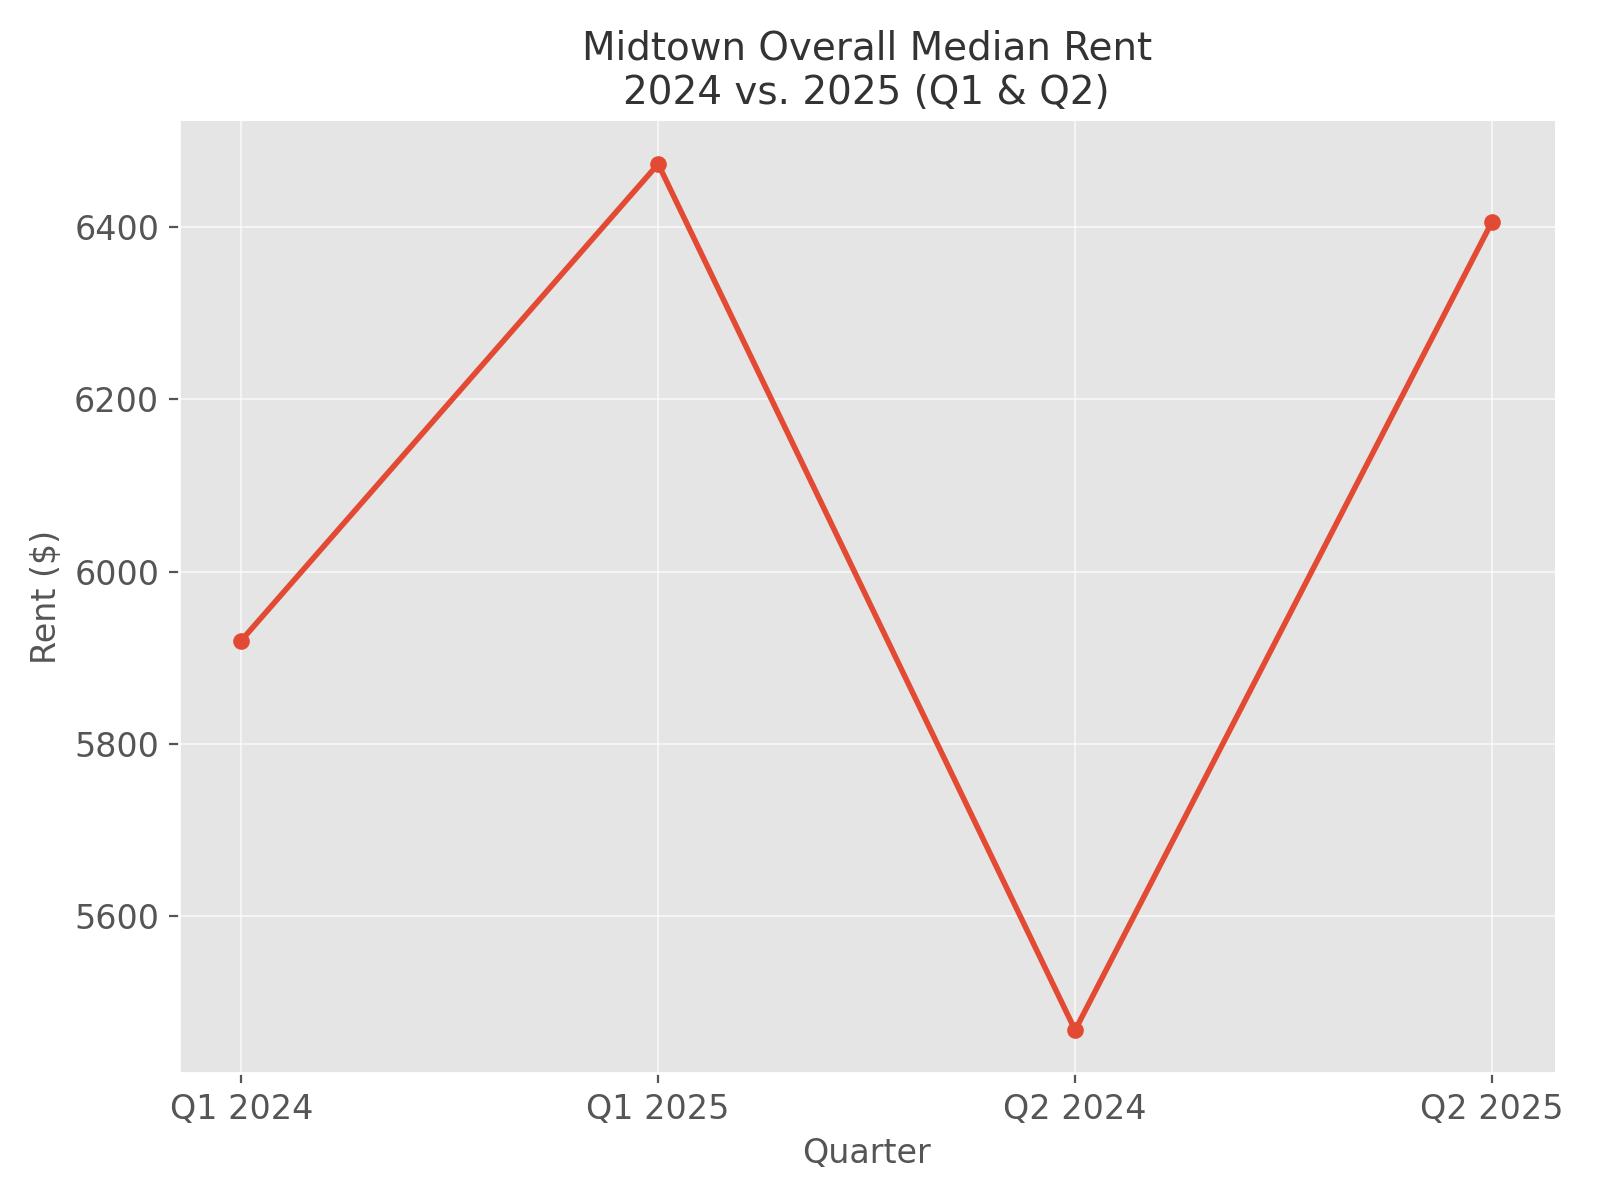
💰 Overall Median Rent Comparison
Q1 2024: $5,920 → Q1 2025: $6,473 (⬆ 9.3%)
Q2 2024: $5,468 → Q2 2025: $6,406 (⬆ 17%)
This confirms what most of us in the business already know: the Midtown rental market is heating up rapidly, and Q2 is when the biggest jumps occur.
👀 What Does This Mean for You?
🎯 For Landlords & Investors:
If you have a unit to list, do it in Q2. The competition is fierce, the DOM is short, and over-asking is becoming more common. Studios are your steady earners, while two- and three-bedrooms are your high-reward bets (if you can ride out the volatility).
🔑 For Renters:
Time your search wisely. Q1 will give you better prices, but Q2 will offer more inventory (at higher prices). Either way, you’ve got to move fast and be ready to compete.
✅ Final Thoughts
If you’re buying, selling, investing—or just trying to rent in this ever-changing Boston market—it pays to work with someone who lives and breathes this data.
I break down the rental market every Tuesday on Instagram and post updates to Facebook, YouTube, and on my website at PageInnisRealEstate.com.
📲 Let’s connect:
Instagram: @Page.InnisRE
Facebook: PageInnisRealEstate
YouTube: Page Innis Real Estate
Website: www.pageinnisrealestate.com
If you’re curious how this data affects your investment property—or you’re just trying to find a place to call home—send me a DM, shoot me a text, or drop me an email. I’m here to help.



Leave a Reply