Single-family homes are a much smaller, more specialized slice of the market in South Boston and the South End compared to condos — and this quarter’s data tells two very different stories for buyers and sellers in each neighborhood.
A quick data note: South End had only two single-family sales all quarter — $3,750,000 in April and $6,400,000 in June — putting the Q2 average sale price at $5,075,000.
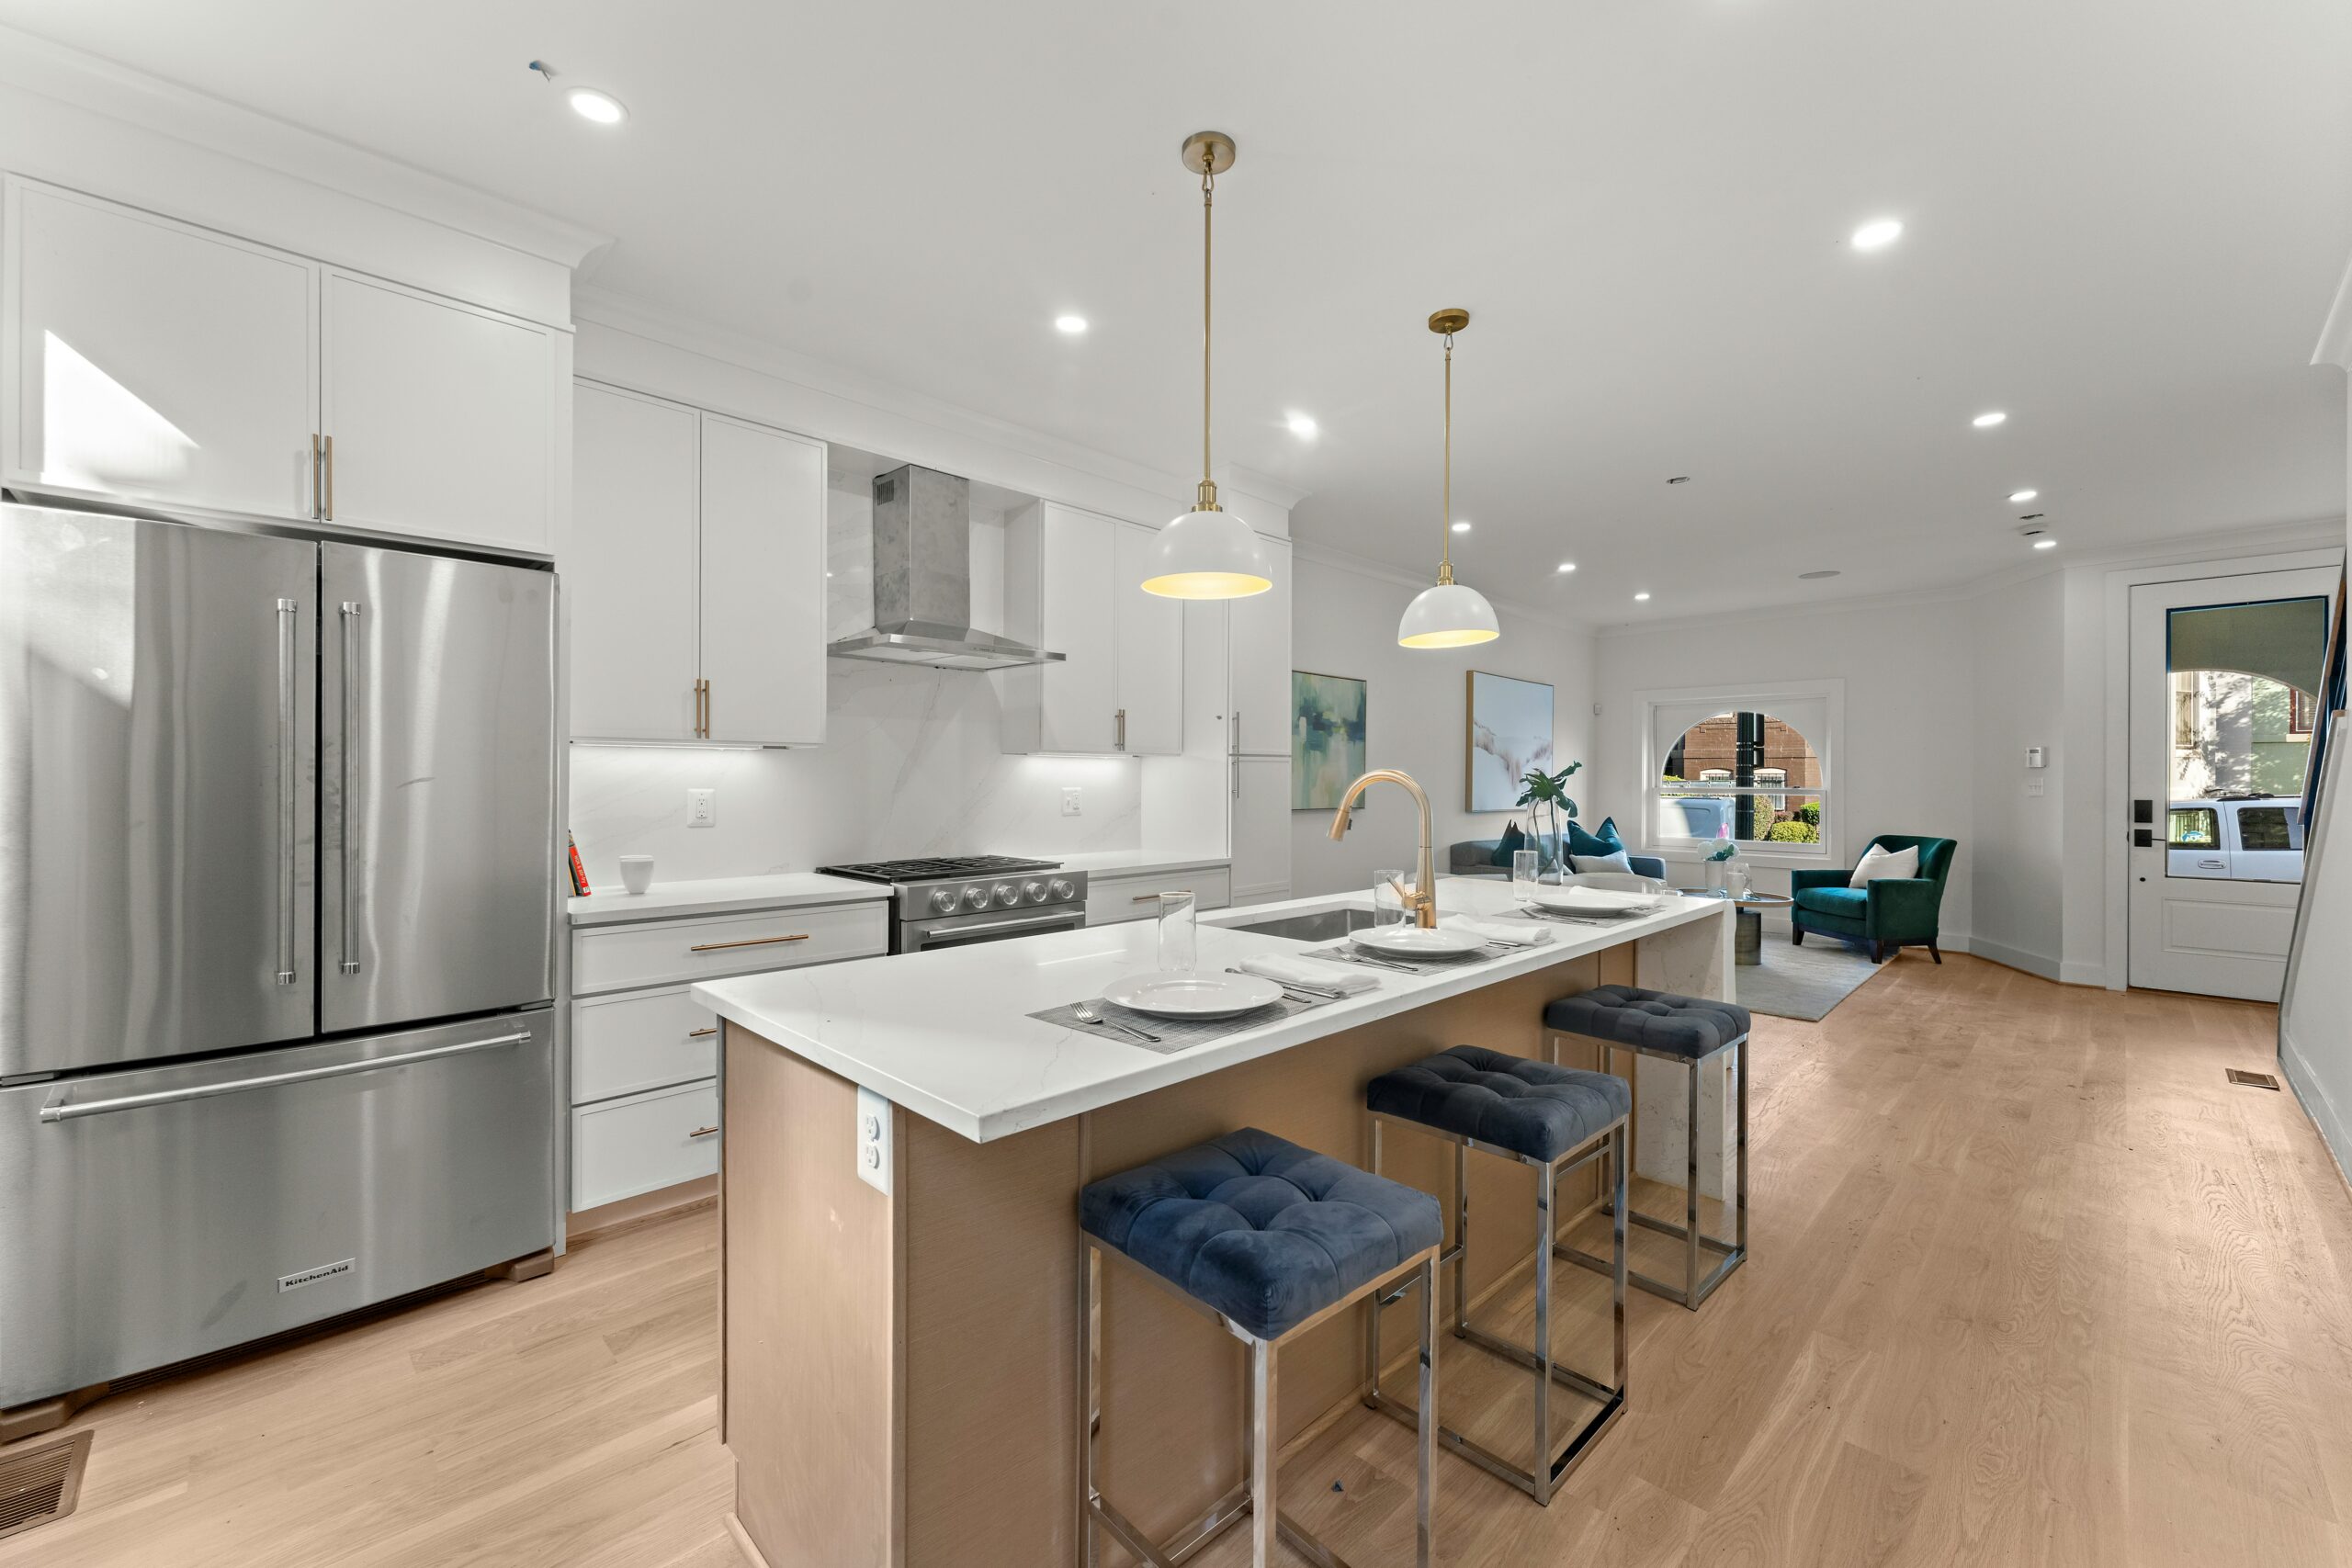
Photo Credit: Photo by asd asd
South Boston
| Month | Homes Closed | Avg. Days on Market | Median Sale Price | % Sold Below Ask |
|---|---|---|---|---|
| April | 2 | 123 days | $940,000 | 50% |
| May | 5 | 40 days | $1,312,000 | 40% |
| June | 8 | 41 days | $1,516,250 | 75% |
Quarter Snapshot
| Metric | Q1 2026 | Q2 2026 |
|---|---|---|
| Average List Price | $1,049,333 | $1,419,167 |
| Average Sale Price | $1,013,333 | $1,379,722 |
| Sale-to-List Ratio | 96.6% | 97.2% |
| Average Days on Market | 48 days | 43 days |
South Boston’s single-family market shows a genuinely interesting pattern this quarter: prices climbed steadily, and volume grew (2 → 5 → 8 closings), but the share of homes selling below asking actually rose too — jumping to 75% in June. That’s a bit counterintuitive at first glance, and it’s worth understanding why: as more homes came to market in June, sellers appeared to test higher asking prices, and buyers pushed back with negotiated offers even as final sale prices kept climbing. In other words, list prices are rising faster than what buyers are actually willing to pay at the closing table.
Average sale price jumped over 36% from Q1 to Q2 ($1,013,333 to $1,379,722), and days on market improved modestly (48 to 43 days) — a market that’s active and appreciating, but not without some real back-and-forth on price.
For Buyers: Don’t be discouraged by rising headline prices — this quarter shows real negotiating room still exists, especially in June, when 3 out of 4 homes closed below their asking price. Come in with a well-researched offer rather than assuming you need to bid over asking to compete.
For Sellers: The market supports higher pricing than earlier in the year, but June’s data suggests buyers are pushing back on aggressive asking prices. Setting a realistic (not maximum) list price is likely to get you a faster, cleaner close than testing the market’s upper limit.
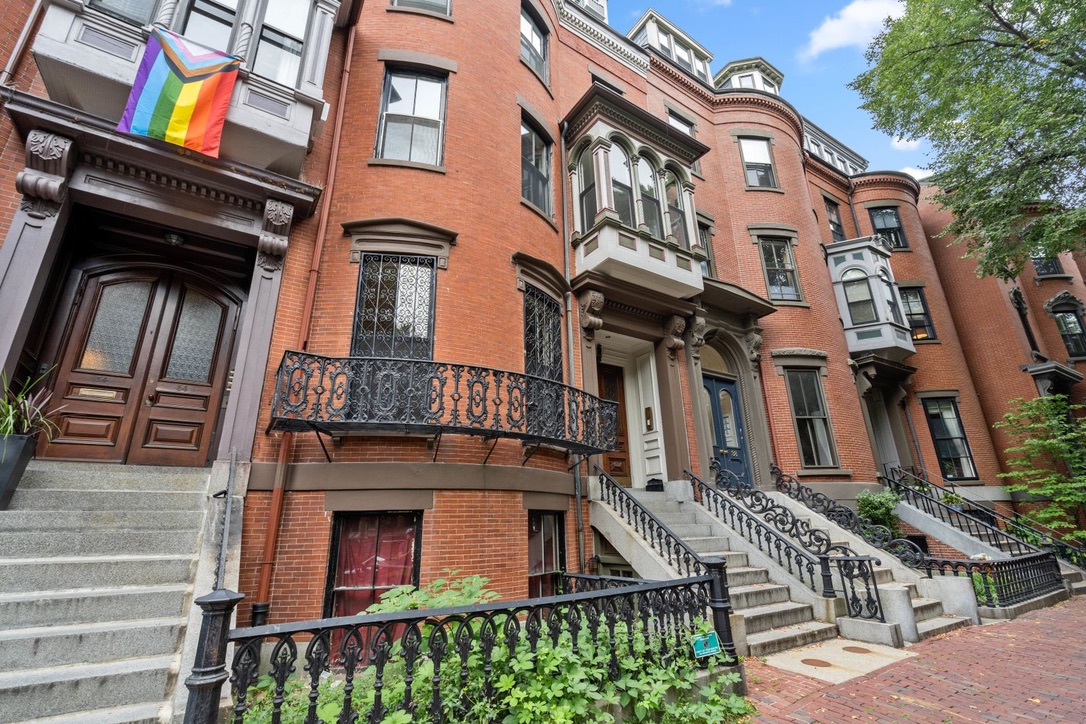
South End
| Month | Homes Closed | Avg. Days on Market | Median Sale Price | % Sold Below Ask |
|---|---|---|---|---|
| April | 1 | 3 days | $3,750,000 | 100% |
| May | 0 | — | — | — |
| June | 1 | 65 days | $6,400,000 | 100% |
Quarter Snapshot
| Metric | Q1 2026 | Q2 2026 |
|---|---|---|
| Average List Price | $3,662,000 | $5,222,500 |
| Average Sale Price | $3,520,750 | $5,075,000 |
| Sale-to-List Ratio | 96.1% | 97.2% |
| Average Days on Market | 89 days | 38 days |
South End’s single-family market is essentially a two-transaction quarter — one sale in April, none in May, and one in June. That’s too thin to draw firm conclusions about neighborhood-wide trends, but a few things stand out: both homes that sold this quarter closed below their asking price, and the April sale moved remarkably fast (just 3 days on market) while the June sale took over two months (65 days). The average days on market improved substantially from Q1 to Q2 (89 to 38 days), largely reflecting April’s quick close.
For Buyers: With virtually no inventory moving each month, be prepared for a long search if you’re specifically targeting South End single-family homes. When something does come to market, both recent sales closed below asking — suggesting sellers in this ultra-high-end, low-volume segment may have some price flexibility, though with only two data points, treat this as a hint rather than a rule.
For Sellers: South End single-family listings remain extremely rare, which can work in your favor — less direct competition — but also means there’s very little recent comp data to lean on. Given both Q2 sales closed under asking, work closely with your agent on realistic pricing rather than anchoring to aspirational per-square-foot figures from other neighborhoods.
Bottom Line
South Boston offers the more complete picture this quarter — a genuinely active, appreciating single-family market where buyers still have room to negotiate even as prices climb. South End’s single-family segment remains a niche, ultra-low-volume market where each individual sale carries outsized weight; anyone active there, buying or selling, should focus on the specific comparable property rather than the neighborhood averages. If you want weekly market reports, subscribe to my YouTube channel, Instagram, or Substack newsletter. If you’re thinking about buying in the South End single-family market in South Boston, contact me.



Leave a Reply